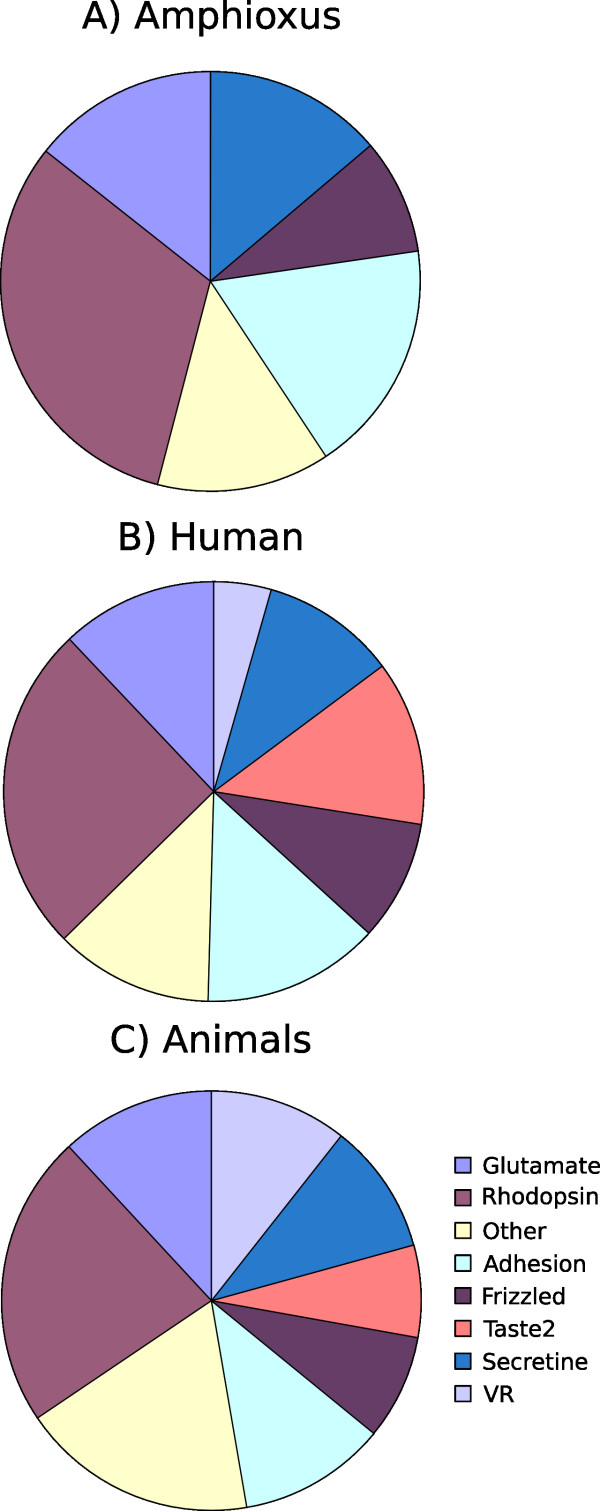
Figure 3.
Distribution of the number of different GPCR families in A) amphioxus, B) Humans and C) All animals, displayed on a logarithmic scale. The Animal diagram is based on an average for amphioxus, humans, Mus musculus, Gallus gallus, Danio rerio, Takifugu rubripes, Ciona intestinalis, Drosophila melanogaster, Anopheles gambiae and Caenorhabditis elegans. The numbers for humans and M. musculus are from [13], G. gallus from [8] and for the remaining species from [4].

