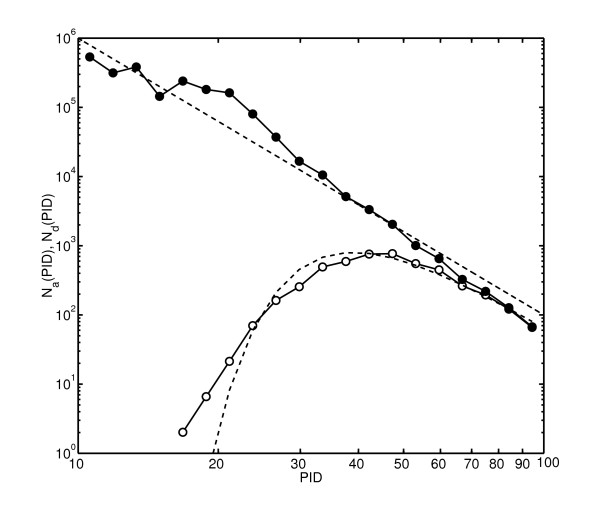
Figure 3.
Histogram of sequence identities in a numerical simulation of proteome dynamics. The histogram of sequences identities of all paralogous pairs Na(p) (filled circles) and duplicated pairs Nd(p) (open circles) in an artificial proteome generated by our numerical model for α = 0.33 and rdup/ = rdel/ = 0.25 as described in the text. Solid line has the slope -4, while the dashed one is given by 6 with γ = 4 and the best fit value of rdel/ = 0.237.

