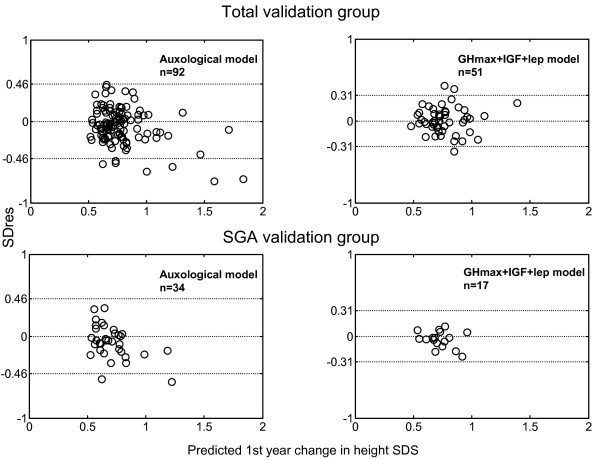
Figure 2.
The SD of the residuals (SDres) in relation to the predicted growth response in the validation group. Individual circles show each child. The 2 SD interval for the model group is indicated by broken lines. Note that 2 SD of the validation group for both models are within the confidence interval, despite the more narrow SDres.

