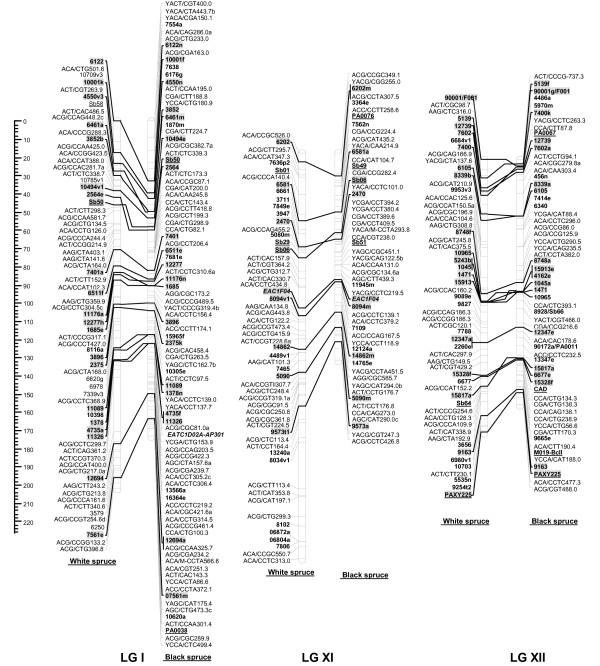
Figure 4.
Comparison of homoeologous linkage groups (LGs) of composite maps for white spruce (on the left) and black spruce (species complex Picea mariana × P. rubens) (on the right). For each taxon, the composite map was obtained by assembly of two parental datasets and use of JoinMap 3.0 and 4.0. [49,50]. Genetic distances are indicated on the left of the figure (Kosambi). Markers in bold are gene SNPs, markers in bold and underlined are ESTPs, markers in bold and italics are SSRs, markers in italic and underlined are RAPDs and all other markers are AFLPs. Markers with a grey background are common between both taxa. Orthologous and paralogous markers are connected by a solid line and dashed line, respectively. Markers not positioned onto homoeologous LGs are printed in white on a black background.

