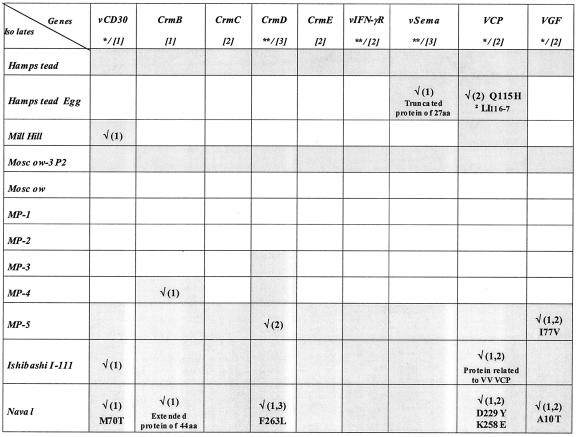
FIG. 3.
Variability of genes encoded by EV isolates and strains. The number of fragments analyzed for each EV gene is shown in brackets. The genes that are predicted from sequence analysis to be active or for which biological activity has been demonstrated are indicated with one or two asterisks, respectively. The variability at the DNA level is marked (√), with the fragment shown in parentheses. Mutations and deletions (2) introduced in the amino acid sequence are indicated. All genes were analyzed by DHPLC, and those that were also sequenced are indicated with a shaded cell.

