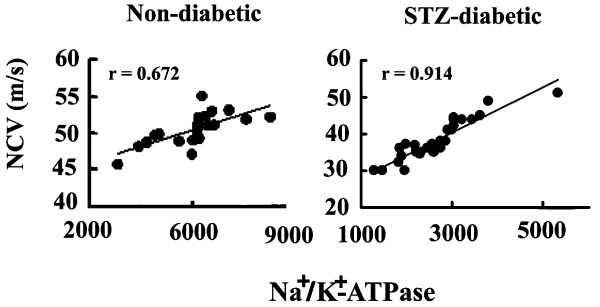
Figure 1.
Correlation of NCV and sciatic-nerve membrane Na+/K+-ATPase activities in non-diabetic rats (n = 22) and STZ-induced diabetic rats (n = 31). Non-diabetic rats consisted of C-group (n = 4), WR-group (n = 6), BR-group (n = 6), and PR-group (n = 6). STZ-diabetic rats consisted of DC-group (n = 4), DWR-group (n = 9), DBR-group (n = 9), and DPR-group (n = 9). Regression lines are shown for analyses that include all data points (n = 22 and n = 31). Pearson's correlation coefficients (r) were used to evaluate simple linear relationship between variables.

