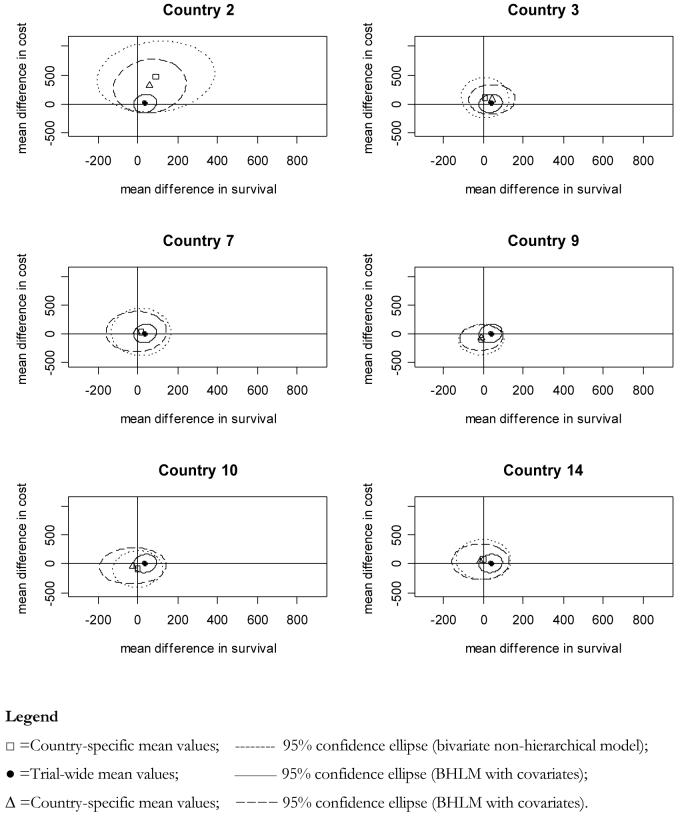
Figure 3. Shrinkage on the cost-effectiveness plane.
The y-axis and x-axis represent, respectively, the estimated difference in mean survival and difference in mean costs. The markers represent the country specific mean estimate of the point with co-ordinates (Δcj,Δsj), together with the relative 95% confidence ellipse.

