
Figure 4.
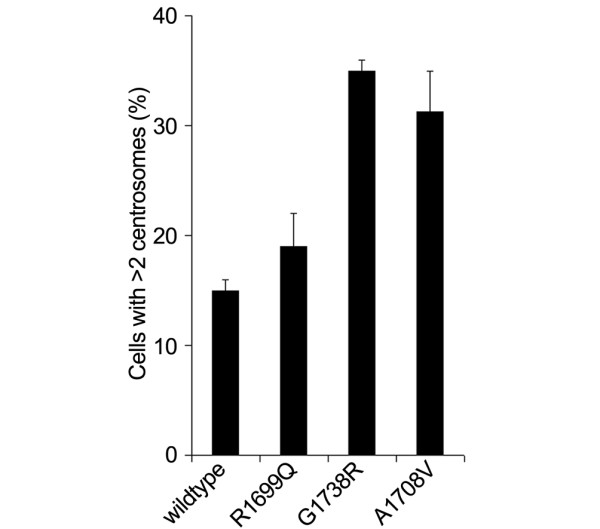
Centrosome amplification. Graphical representation of percentage of cells transfected with BRCA1 wild-type and variants that display centrosome amplification (greater than two centrosomes). Values are the mean and standard error of duplicate studies.