
Figure 1.
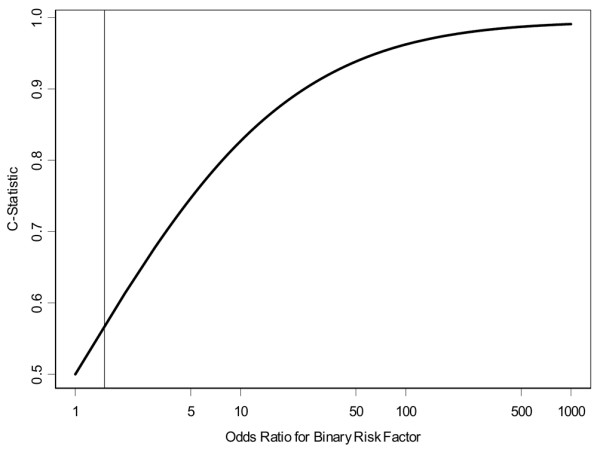
Relationship between odds ratios (ORs) ranging from 1 to 1,000 and C-statistic for binary risk factor and outcome. Vertical line represents an OR of 1.5, which corresponds to the risk prediction possible using a Gail model risk probability of 0.0167 as a binary cut point [46].