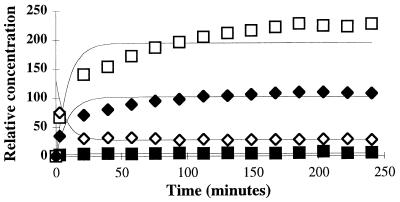
Figure 2.
CE analysis of octasaccharide O2 digestion mixture. A full CE electropherogram is shown in the accompanying paper by Rhomberg et al. (14). O2 (hollow diamond) is degraded to form tetrasaccharides T5 (solid square) and T9 (solid diamond) and disaccharide Di6 (hollow square). Lines indicate best fit to reaction model (see text). The curve corresponding to O2 approaches a nonzero value due to the presence of an uncleavable impurity, also observed in the MS analysis of this substrate, as described (14).

