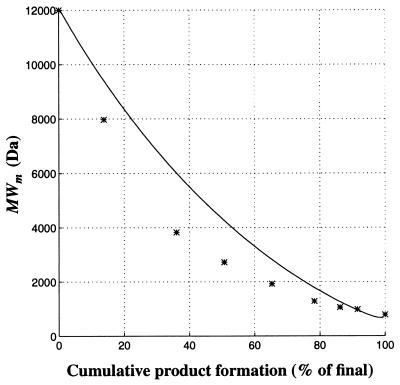
Figure 6.
Changes in mass-average molecular weight (MWm) and cumulative product formation during heparin digestion with heparinase I. Results from a computer simulation (see text) are plotted (line) and compared with the experimental data (stars) of Jandik et al. (10). MWm was determined from viscosity measurements, as described (16).

