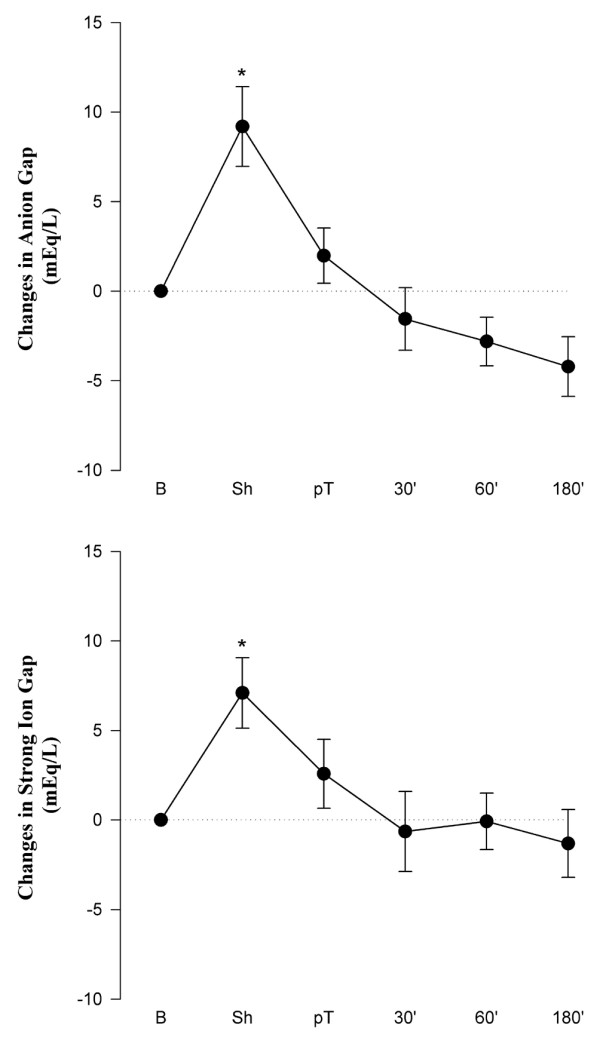
Figure 3.

Changes in anion gap (upper panel) and strong ion gap (lower panel) versus baseline at the different measuring points. Absolute values are given in Table 1. Values are mean ± standard error of the mean (n = 8). *p < 0.05 with respect to baseline. 30', 60', and 180' indicate time (in minutes) after resuscitation. B, baseline; pT, post-treatment; Sh, shock.
