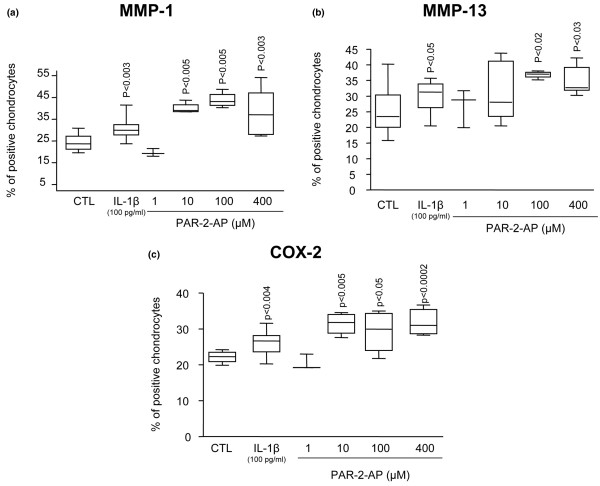
Figure 4.
Production of metalloproteinase (MMP)-1 (a), MMP-13 (b), and cyclooxygenase 2 (COX-2) (c) following interleukin 1 beta (IL-1β) and specific proteinase-activated receptor 2 (PAR-2) activation. Immunostaining data of osteoarthritic cartilage untreated (n = 12) and treated with IL-1β (n = 12), PAR-2-activating peptide (PAR-2-AP) 1 μM (n = 3), PAR-2-AP 10 μM (n = 4), PAR-2-AP 100 μM (n = 4), and PAR-2-AP 400 μM (n = 9). P values indicate the comparison with the untreated (CTL) specimens.

