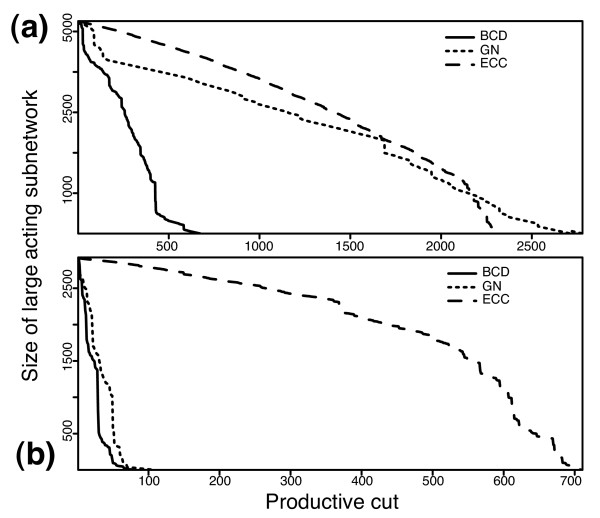
Figure 4.
Decomposition curves for the largest sub-networks of two datasets on (a) unfiltered data and (b) filtered data by the three algorithms. During the decomposition process, the larger connected component and the larger one of its derived sub-networks are always decomposed earlier. The y-axis shows the size of the sub-network under decomposition and the x-axis shows the number of productive cuts so far. A productive cut means the removal of an edge splitting one network into two disconnected parts.

