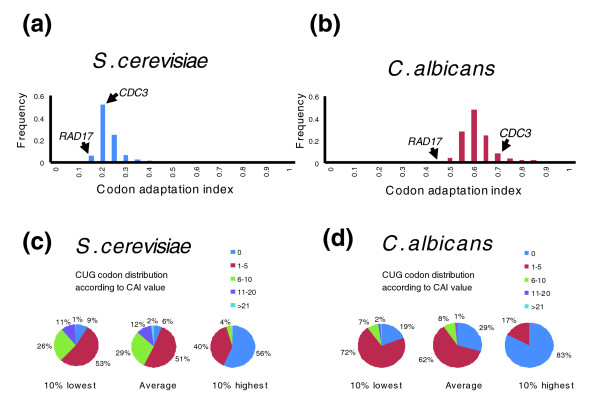
Figure 5.
Distribution of CAI values for Saccharomyces cerevisiae and Candida albicans. The codon adaptation index (CAI) values for the genes of both (a) S. cerevisiae and (b) C. albicans genes were determined using the ANACONDA algorithm [66]. The CAI value is a measure of synonymous codon usage bias, which was obtained by extracting the codon usage frequencies from a set of reference genes, and scoring each gene according to its codon usage value [67]. In general, C. albicans CAI values were greater than those of S. cerevisiae. (c,d) The distribution of CUG codons per gene according to their CAI ranking order. In C. albicans, CUG codons were strongly underrepresented in the 10% of genes with higher CAI values.

