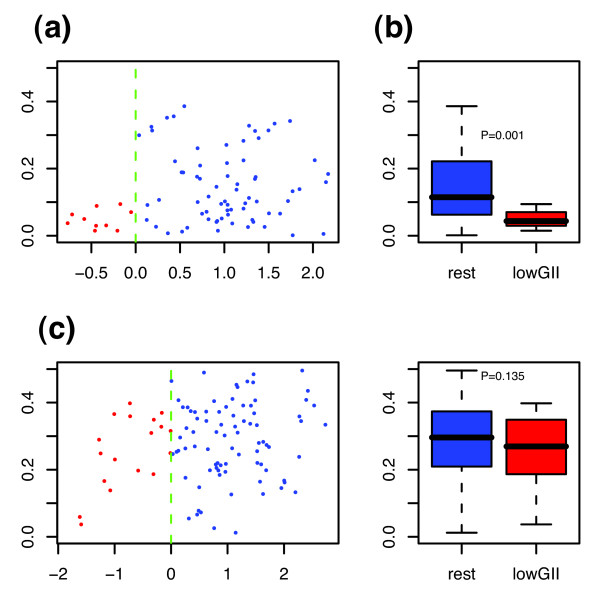
Figure 4.
Genomic instability index versus LD-scores. (a), (c), GII is plotted against the linear discriminant (LD) scores for the 86 samples profiled in [12] and the 101 samples of the CAL cohort [6]. Those samples with a negative LD score were classified into the low-GII subgroup (red), the rest are shown in blue. (b), (d), Corresponding boxplots showing the GII distributions of the two predicted subgroups.

