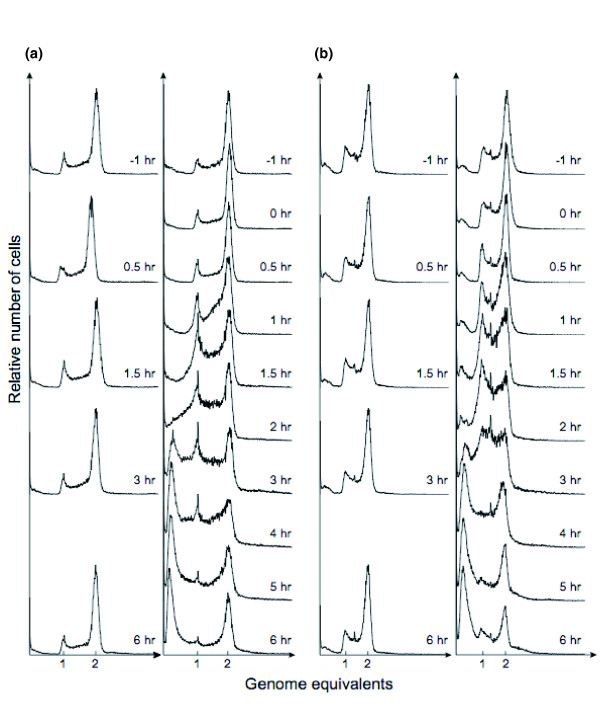
Figure 4.
Flow cytometry DNA content distributions. Flow cytometry DNA content distributions for (a) S. solfataricus and (b) S. acidocaldarius from untreated control cultures (columns 1 and 3) and UV-irradiated cultures (columns 2 and 4) at different time points after treatment. The minor peak at a DNA content corresponding to 1.5 chromosome equivalents in the S. acidocaldarius distributions (columns 3 and 4) is a software artifact.

