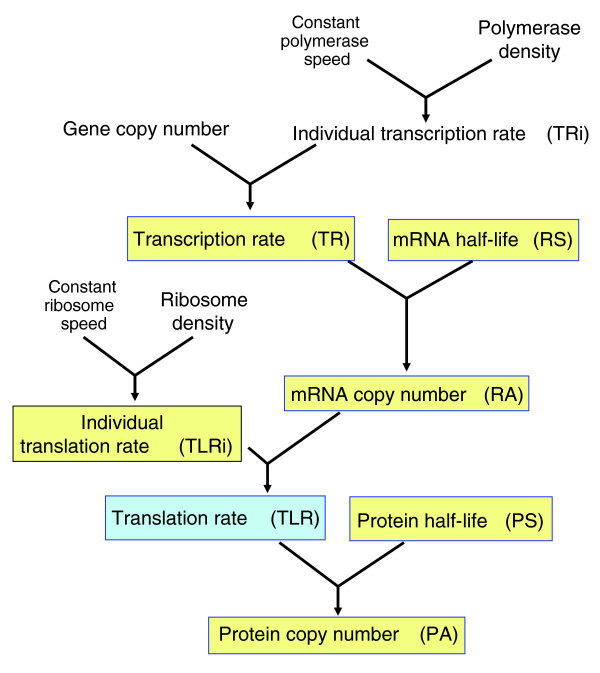
Figure 1.
Schematic representation of the steps in the gene expression flow from DNA to protein. Convergent lines with arrowheads indicate the two variables that are combined to generate the next one. In this flow there are two synthesis steps, transcription and translation, yielding mRNA and protein molecules, respectively. The amount of such molecules (RA and PA, respectively) is the consequence of a balance between their synthesis and their degradation. Individual transcription rates (TRi and TLRi) multiplied by copy number gives the total transcription and translation rates (TR and TLR). Whereas synthesis rates are calculated as the number of molecules synthesized in a given time, degradation is expressed here as the half-life of the molecule. The RA depends only on its TR and stability (RS). The PA depends not only on its TLR and stability (PS) but also on the RA. Highlighted in yellow are the variables used in this study that have been obtained experimentally and in blue those that have been mathematically calculated from other studies.

