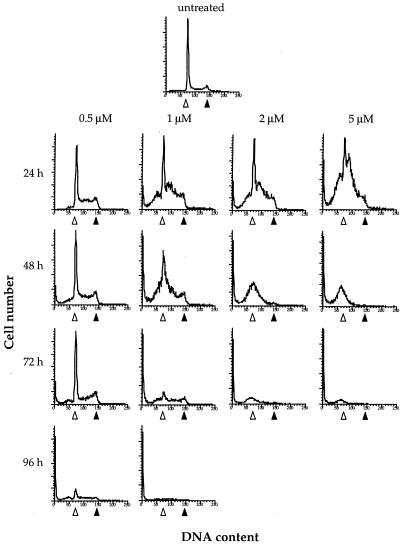
Figure 2.
Cell cycle progression of HeLa cells treated with cisplatin. Histograms of DNA content per cell number of HeLa cells untreated and treated with 0.5, 1, 2, or 5 μM are shown. Cells were maintained in the presence of cisplatin for 24, 48, 72, or 96 h without a change in medium and collected at the times indicated. The DNA content at G1 (▵) and G2 (▴) in untreated cells is indicated.

