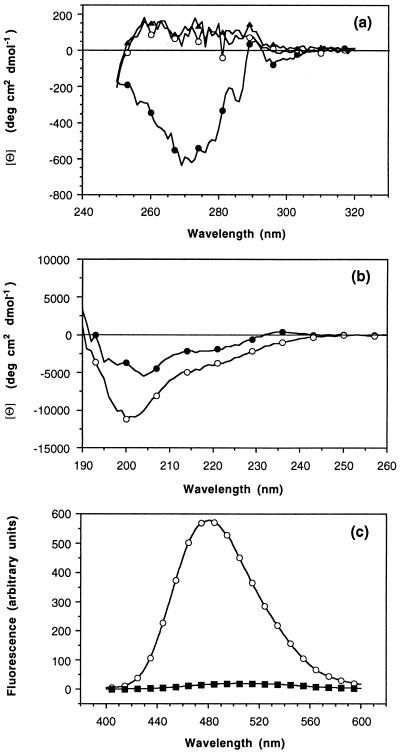
Figure 5.
CD spectra of PI3-SH3 in the near- (a) and far-UV (b) regions (20°C). Native state, pH 7.2 (•); A state, pH 2.0 (○); and denatured state in 3.5 M GuHCl (▴). For the near-UV spectra, the ellipticity is expressed in terms of molar ellipticity per aromatic residue. Protein concentration was determined spectrophotometrically by using an extinction coefficient of 1.896 (mg/ml)−1 cm−1 for the native and A states and of 2.011 (mg/ml)−1 cm−1 for the denatured protein. Extinction coefficients were determined as described in ref. 32. (c) Fluorescence emission spectra of ANS (250 μM) in the presence of 15 μM PI3-SH3 (○) and without protein (▪) acquired on pH 2.0 samples at 20°C. The excitation wavelength was 370 nm, and the excitation and emission monochromator slit widths were both set to 5 nm.

