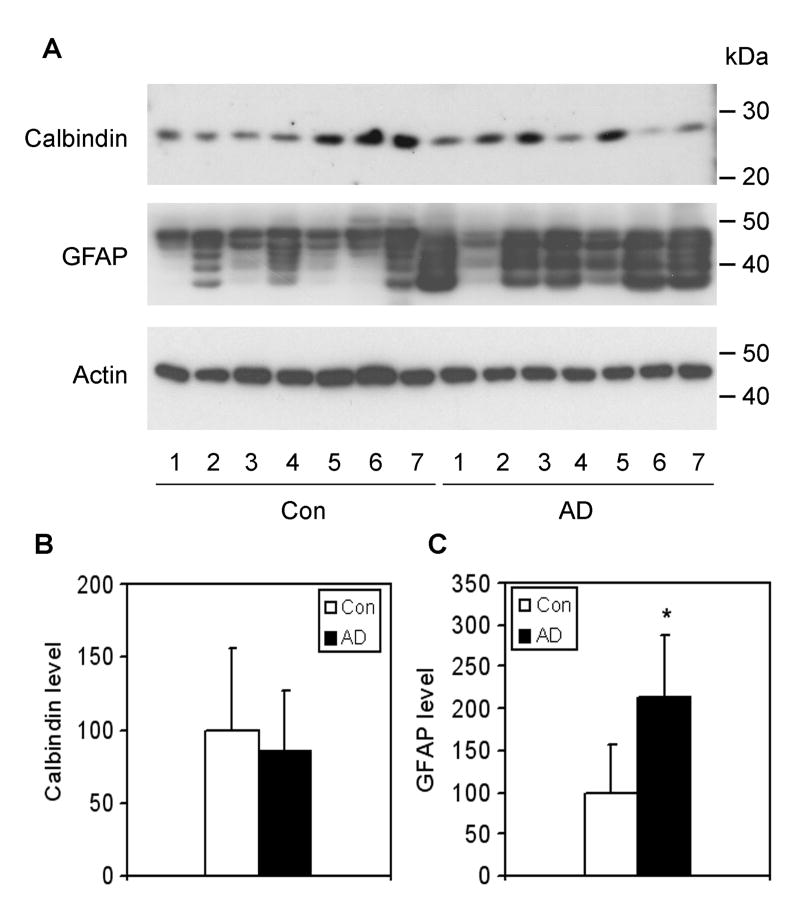
Fig. 5.
Levels of calbindin and GFAP in AD and control brains. (A) Crude extracts of frontal cerebral cortices from 7 AD and 7 control cases were analyzed by Western blots developed with anti-calbindin or anti-GFAP. Actin blot was included as a loading control. (B) The blots were quantified densitometrically and normalized by the actin blot. Data are presented as percentage of the controls (mean ± SD; *, p < 0.05).

