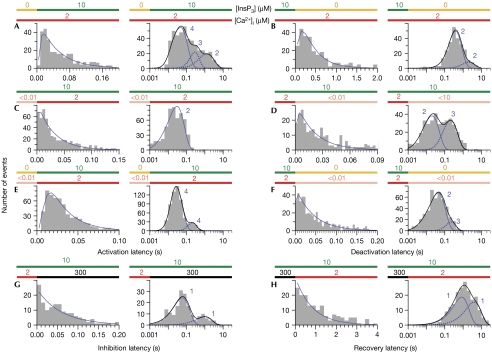
Figure 2.
Latency histograms of InsP3R channels responding to changes in [InsP3] and [Ca2+]i. [InsP3] and [Ca2+]i are denoted by the coloured bars above each histogram. For each type of ligand concentration change investigated, both the linearly binned histogram (left) covering a limited latency range and the logarithmically binned histogram (right) showing the complete range of latencies over all times are shown. In each logarithmically binned histogram, each blue curve is the theoretical fit generated using one linear Markov chain scheme with the tabulated number of functionally indistinguishable conformations (supplementary information online). The black curve is the sum of the theoretical fits if several linear Markov chains were required. In each linearly binned histogram, the blue continuous curve is evaluated using the fastest linear Markov chain scheme and therefore is equivalent to the blue continuous curve in the corresponding logarithmically binned histogram. The range of the x-axis was selected so that the histogram includes at least 95% of the events described by the fastest linear Markov chain scheme. InsP3R, inositol 1,4,5-trisphosphate receptor.

