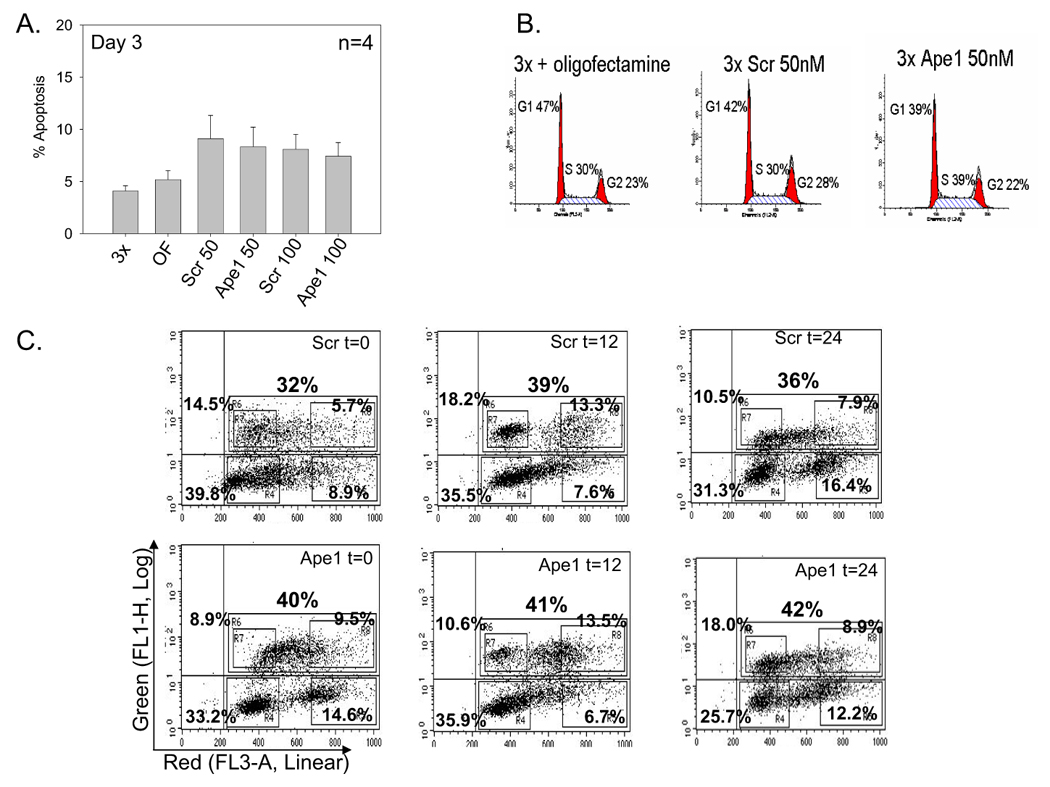
Figure 3.

Apoptosis and cell cycle analysis of SKOV-3x cells following siRNA treatment at Day 3. A. Bar graph showing the average % apoptosis in 4 independent experiments ± SE; B Representative histogram plots of SKOV-3x cells treated with oligofectamine, scrambled (scr) siRNA 50nM, and Ape1 siRNA 50nM stained with PI; C. BrdU incorporation assays at t=0, 12, & 24 hr. Representative dot plots of SKOV-3x cells treated with scrambled (scr) siRNA 50nM (top panel), and Ape1 siRNA 50nM (bottom panel) stained with BrdU-FITC antibody and 7-AAD.
