
Figure 6.
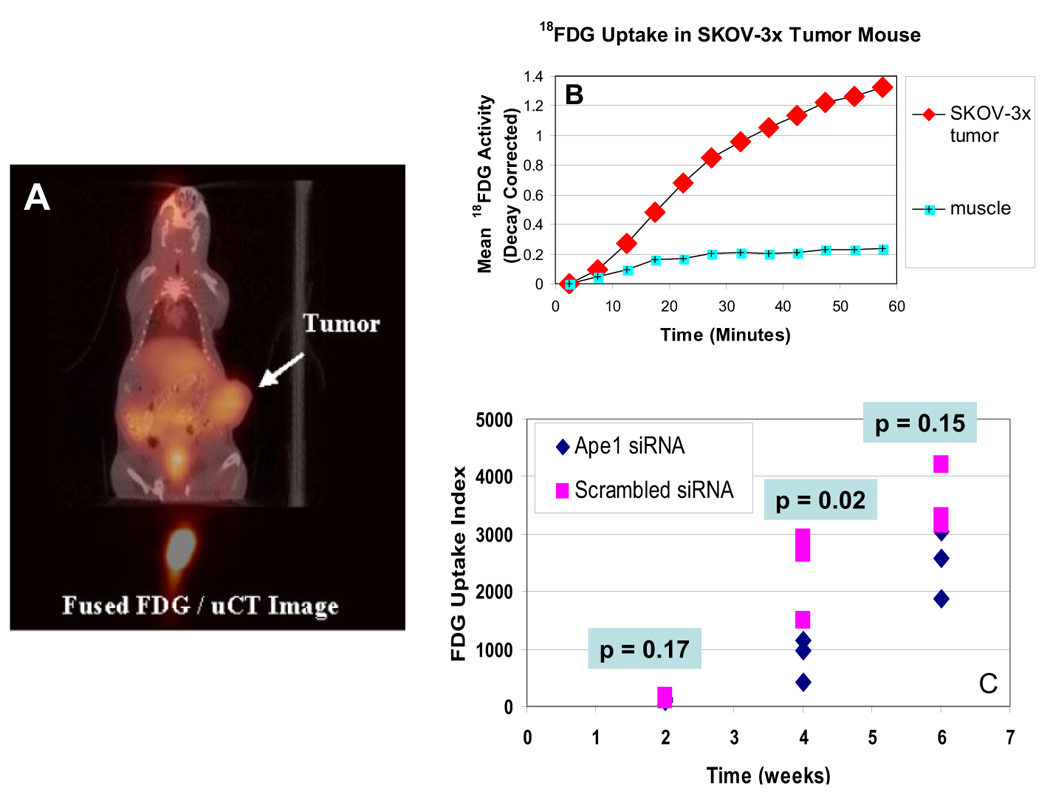
A. Fusion Image of FDG Uptake with x-ray CT anatomy. The uptake of FDG in the SKOV-3x tumor can be readily identified in the tumor as well as the bladder and liver. The area of high FDG accumulation below the acquired CT image is the injection site in the tail vein. B. Time activity curves for FDG uptake in SKOV-3x tumor xenograft. A region of interest was placed within the tumor volume shown and a second region of interest was placed over a skeletal muscle in the thigh of the mouse. The curve demonstrates a tumor/muscle contrast ratio of ~5 at 60 minutes post tracer injection. C. Graph showing the FDG uptake for individual mice at 2, 4, and 6 weeks following injection. An index of tumor FDG uptake was generated for each tumor by calculating the total FDG uptake in the tumor normalized by the mass of the animal and the injected dose of tracer. A paired two-tailed t test was used to determine significance.