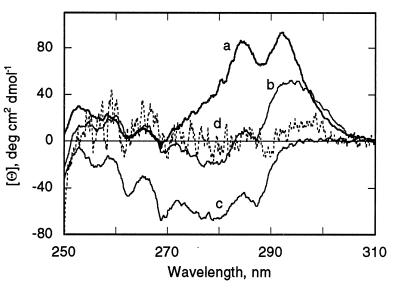
Figure 2.
Decrease in amplitude of UV CD spectrum of P178s on binding to membranes. Near UV CD spectra: a, P178s (bold trace); b, single Trp (Trp-424) mutant of P178s; c, zero Trp mutant of P178s; d, P178m at lipid/P178 molar ratio of 240:1 (dotted trace). Conditions are otherwise as in Fig. 1A.

