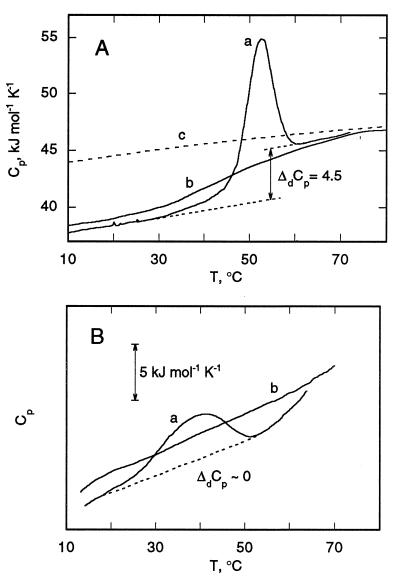
Figure 5.
Cp temperature dependence of P190s (A) in 100 mM NaCl/20 mM sodium acetate, pH 4.0, and P190m (B) in the same buffer. (A) Curves: a and b, first and second calorimetric scans; c (dashed line) theoretical temperature dependence of Cp of P190s calculated from amino acid content. ΔdCp for transition from low to high temperature states of P190s, determined by extrapolation from these states, is shown. (B) Curves a and b are the first and second scans.

