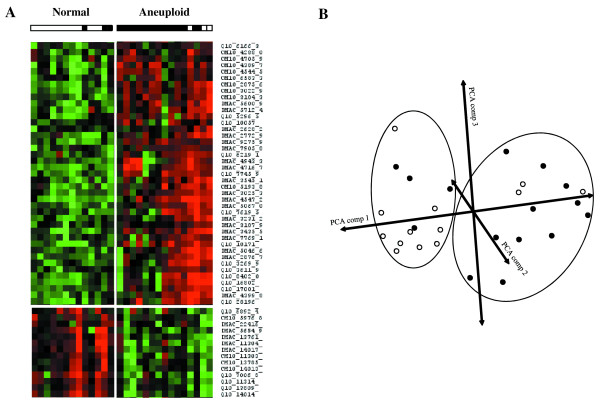
Figure 2.
Heat cluster map and principle component analysis (PCA) of aneuploidie amniotic fluid and normal samples. All 208 protein peaks from 2.5 to 50 kDa mass range and 3 different surface arrays were pooled to generate a heat cluster map (A) and PCA diagram (B). The PCA diagram illustrates the segregated samples based on normal (white circles) and aneuploidie (black circles) samples.

