
Figure 6.
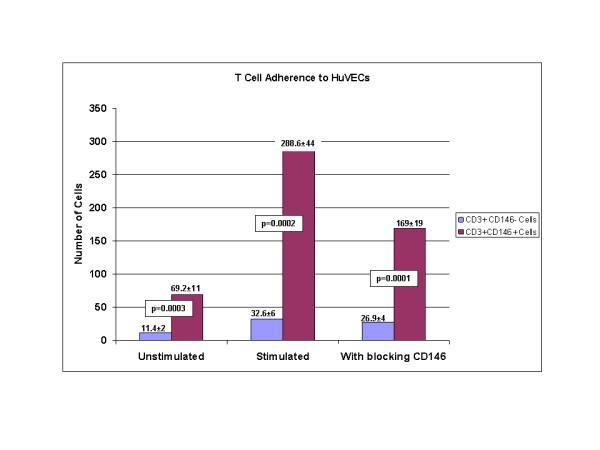
Adherence of T cells to activated endothelial monolayers. Cells were sorted by flow cytometry into two populations – one was CD3+CD146-, the other CD3+CD146-+. Cells were tested without stimuation, with PHA stimulation, and with CD146 blocking antibody following stimulation, as described in the methods. Data are shown as adhered cells per high powered field of light microscopy. The mean and standard deviations of 5 replicate experiments are shown. P values from paired t tests are shown.