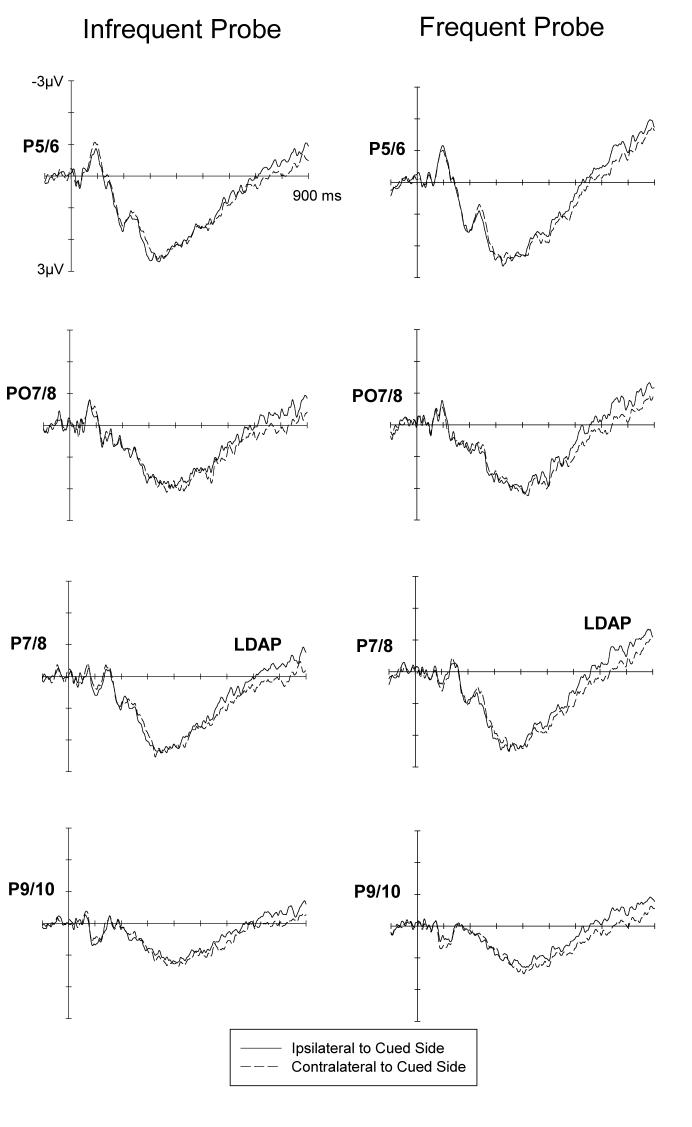
Figure 2.
Grand-averaged ERPs elicited in the 900 ms interval following cue onset at lateral posterior electrodes ipsilateral and contralateral to the cued side, for the infrequent and frequent probe conditions. LDAP: Late Directing Attention Positivity. Scalp distribution map of the LDAP showing a maximum over lateral posterior electrode sides in the time interval between 700 and 800 ms (maximum effect) after cue onset. This map represents the difference between ipsi- and contralateral brain activity. It was constructed in the same was as for the ADAN. As a result of the mirroring procedure, the LDAP appears as negative voltage (blue) over the left hemisphere and as positive voltage over the right hemisphere (red). Amplitudes range between from −0.6 and0.6μV; each line represents an increment of 0.1μV.

