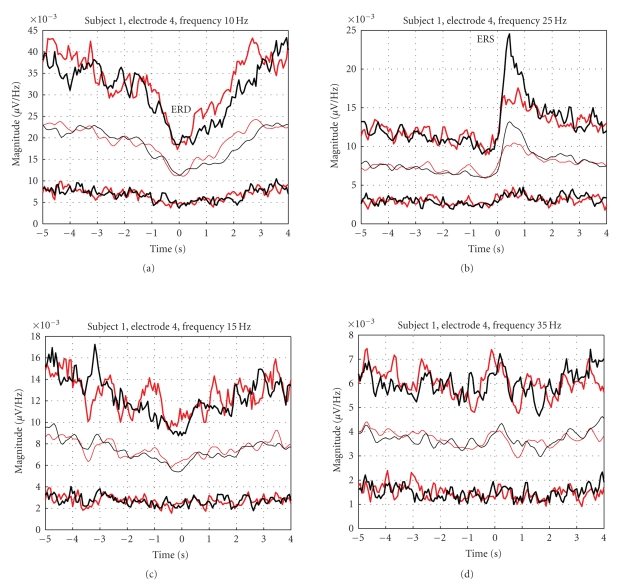
Figure 4.
Confidence intervals computed for the selected frequency components (subject 1, electrode 4); see also Figure 1. Black:thumb flexion; red:little-finger flexion; thin lines:average courses of the indicated spectral components; thick lines:boundaries containing 75 % of the real EEG realizations.

