
Figure 1.
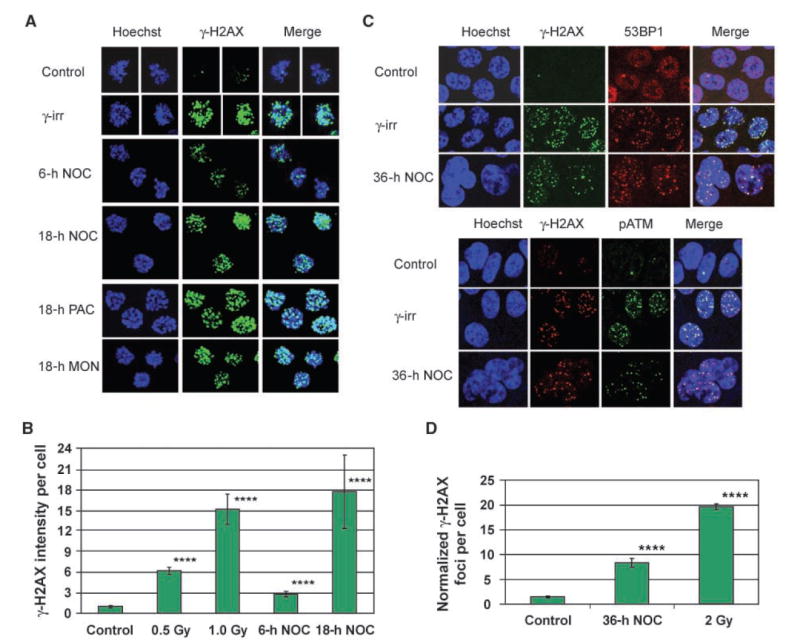
γ-H2AX foci accumulate during drug-induced mitotic arrest in HCT116 cells. A, maximum projection images of stacks of prometaphase cells stained for γ-H2AX. γ-irr, 30 min after 2-Gy γ-irradiation. NOC, nocodazole; PAC, paclitaxel; MON, monastrol. B, quantification of γ-H2AX pixel intensity per prometaphase cell. Columns, mean from at least 60 cells per sample taken from two independent experiments; bars, SE. ****, P < 0.0001, compared with control (t tests on log-transformed values, which were normally distributed). C, single focal planes of interphase cells costained for γ-H2AX and either 53BP1 or pATM. D, quantification of γ-H2AX foci per interphase cell. To adjust for cell cycle differences in DNA content, foci number was normalized to the DNA content of a 2N cell using the Hoechst signal. Columns, mean from at least 145 cells per sample taken from three independent experiments; bars, SE. ****, P < 0.0001, compared with control (Mann-Whitney tests). Specificity of the mouse anti–γ-H2AX antibody is shown in Supplementary Fig. S5.