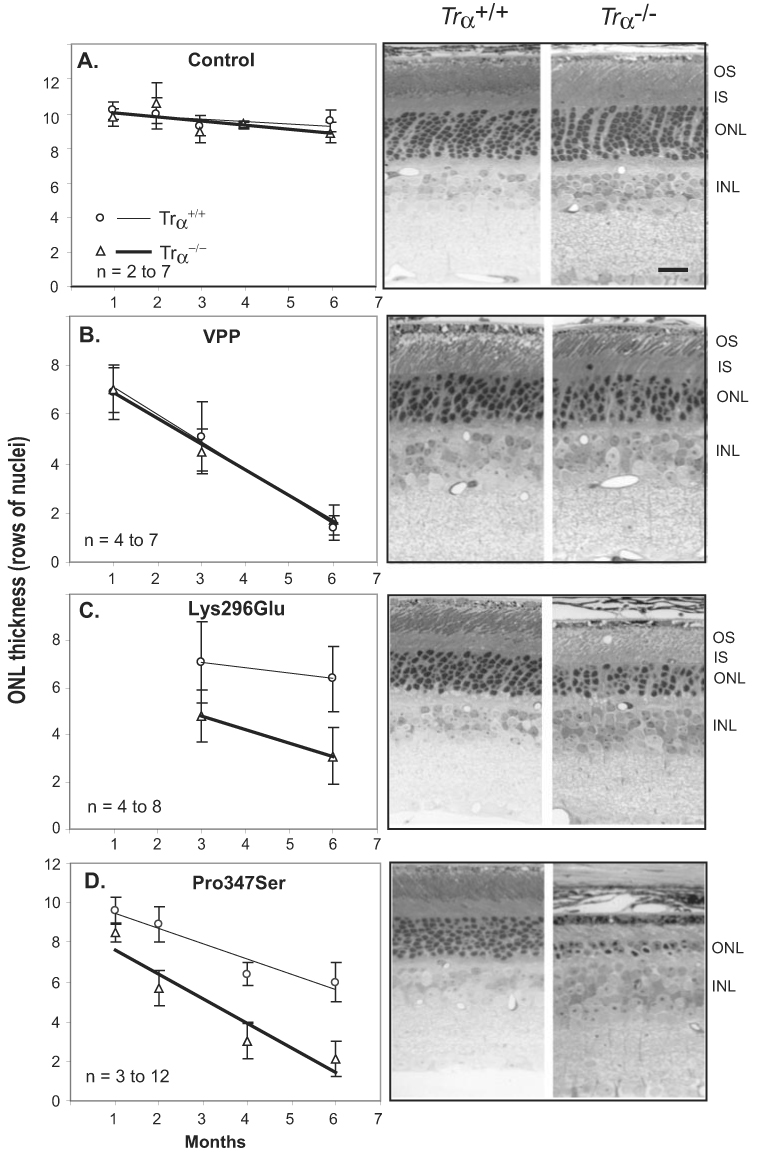
FIGURE 1.

Comparison of rhodopsin mutant mice on Trα+/+ and Trα−/− genetic backgrounds. (A) Time course of degeneration in Trα+/+ (○) and Trα−/− (△) mice (left); retinal morphology at 3 months (right). (B) VPP, Trα+/+ (○) and VPP, Trα−/− (△) degeneration kinetics (left); retinal morphology at 3-months (right). (C) Lys296Glu, Trα+/+ (○) and Lys296Glu, Trα−/− (△) degeneration kinetics (left); retinal morphology at 3 months (right). (D) Pro347Ser, Trα+/+ (○) and Pro347Ser, Trα−/− (△) degeneration kinetics (left); retinal morphology at 6 months (right). OS, outer segment; IS, inner segment; ONL, outer nuclear layer; INL, inner nuclear layer. n = number of animals sampled at each time point. Scale bar, 10 µm.
