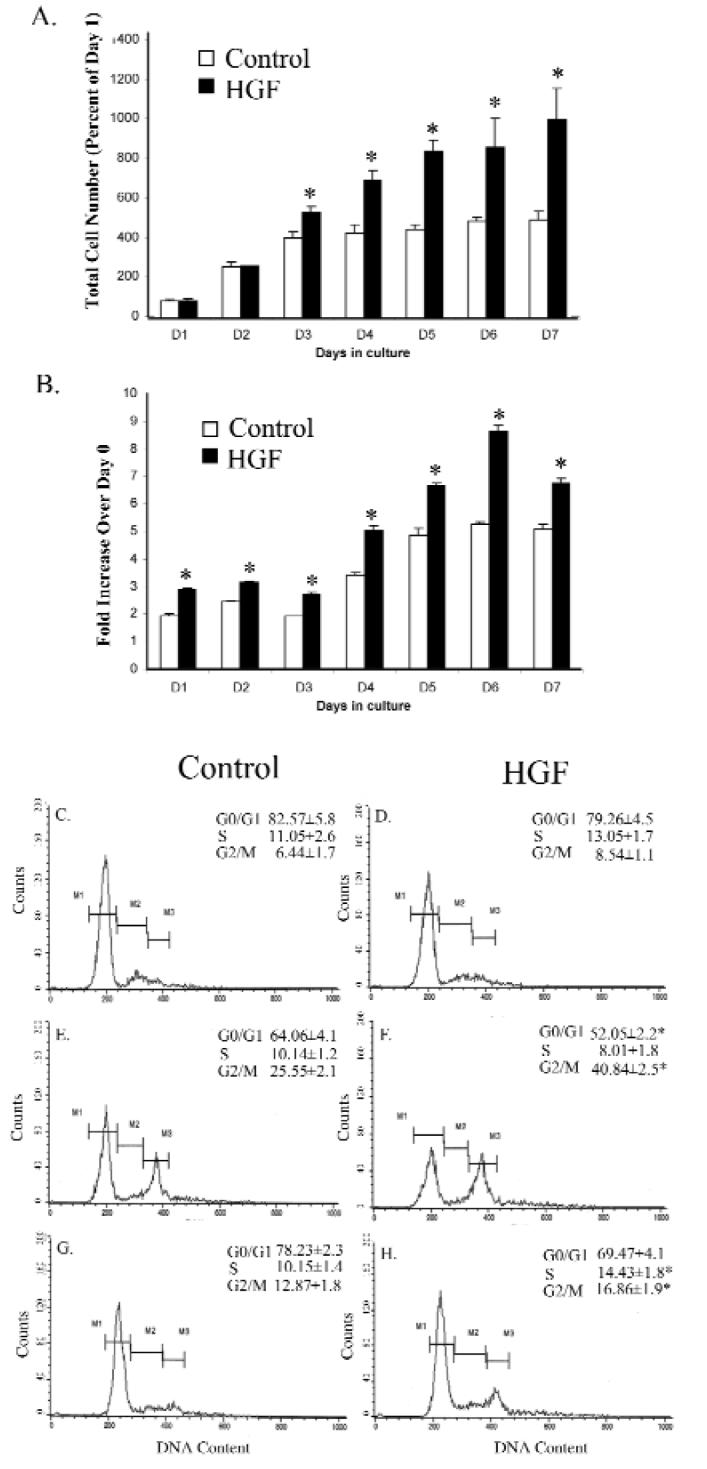
Figure 2.

Cell proliferation, 5-bromo-2-deoxyuridine uptake, and cell cycle profiles in fibroblasts. Fibroblasts from normal control (N = 3 individuals) and HGF patients (N = 3 patients) were compared. At indicated time-points, total cell numbers (A) or 5-bromo-2-deoxyuridine incorporation into DNA (B) were determined from triplicate samples. The data are presented as an average with standard deviations; * indicates P < 0.05. (C-H) Fibroblast cultures were prepared under 3 different conditions as described below. Panels C, E, and G are normal control fibroblasts, and panels D, F, and H are HGF fibroblasts. (C,D) Cultures under starving media conditions for 2 days. (E,F) Cultures under starving conditions for 1 day and switched to growth media for one day. (G,H) Cultures under starving conditions for 1 day and switched to growth media for 3 days. The percentages of total cells contained in different cell cycle phases are indicated. M1 represents the “Go/G1” phase, M2 denotes the “S” phase, and M3 denotes the “G2/M” phase. Significant difference between control and HGF is marked with asterisks (P < 0.05).
