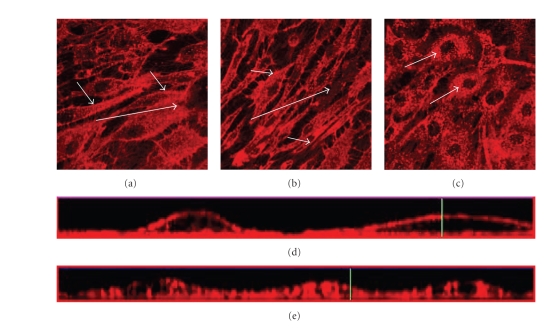
Figure 1.
Effects from flow on the thickness and integrity of the glycocalyx layer of PAEC exposed to flow shear stress at 11 dynes/cm2 and under static conditions for control. The glycocalyx layer is visualized under the confocal microscope through staining of heparan sulfate with Texas Red-conjugated lectin after different times in culture. (a) Cells exposed to flow shear stress for 24 hours, (b) cells exposed to flow shear stress for 48 hours, and (c) cells grown under static conditions for 24 hours. The images are cross-sections of the cell monolayer = 0.5–2 μm with = 0 at the glass surface. Large arrows indicate approximate flow directions. Small arrows indicate the distribution of the stain, predominantly located in the interior of the cells not exposed to shear stress compared to the shear-exposed cells where it is most abundant at the surface. Figures 1(d) and 1(e) are the cross-sections from the side of the stack of images created with confocal microscopy with (d) cells exposed to shear stress for 24 hours and (e) cells grown under static conditions for 24 hours.

