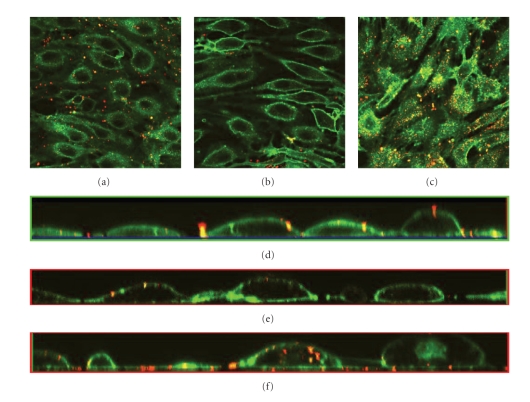
Figure 5.
Flow effects on the glycocalyx layer and uptake of LDL. PAEC incubated with LDL after exposure to different conditions of flow. The glycocalyx layer is visualized under the confocal microscope through staining of heparan sulfate with FITC-conjugated lectin (green) and LDL added as DiI complex (red) after different times in culture. (a) Cells exposed to flow shear stress for 24 hours, (b) 48 hours, and (c) cells grown under static conditions for 24 hours. Internalized LDL appears yellow when colocalized with heparan sulfate stain. (d) Cross-section from the image stacks created with confocal microscopy of the stack (a), (e) cross-section from the side of the stack (b), and (f) cross-sections from the side of the stack (c).

