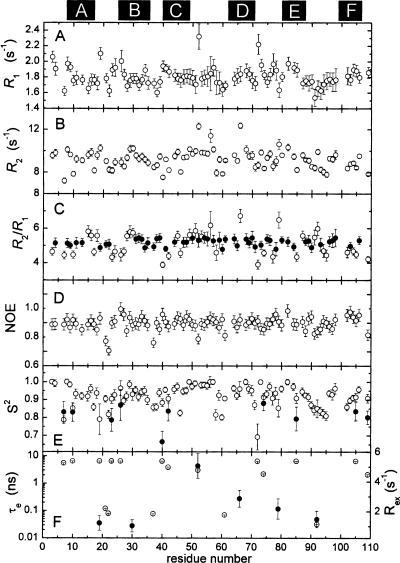
Figure 7.
Summary of 15N relaxation data and internal mobility analysis. (A) Experimental R 1 values. (B) Experimental R 2 values. (C) R2/R1 ratios. Filled circles (●) denote amide vectors included in the calculation of the mean value. (D) Experimental {1H}15N NOE values. (E) Generalized order parameter (S 2) determined by model-free analysis, as described in the text. A subset of the residues required inclusion of a second order parameter (●), corresponding to motion on a slower timescale, to satisfactorily model their relaxation behavior. (F) τ e (○) and R ex (●) values for those residues displaying motion on a timescale exceeding 20 psec. The locations of the six helical elements are indicated at the top of the figure.

