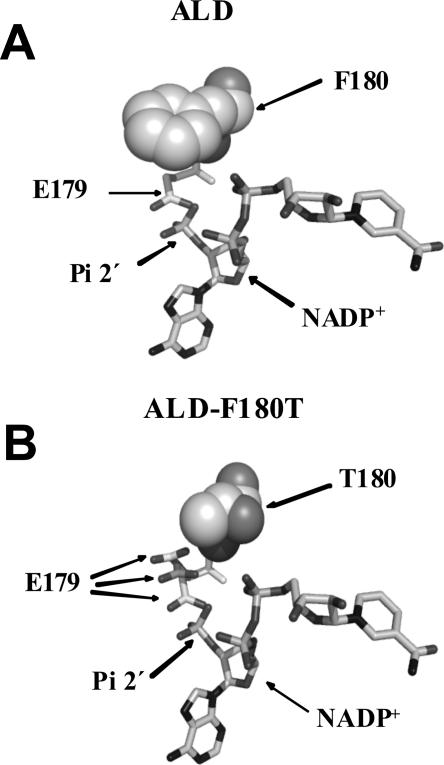
Figure 4.
Comparison of the coenzyme binding site of ALD and ALD-F180T. (A,B) F180 and T180 are shown as spheres, while E179 and NADP+ are shown as sticks. E179 is shown in three different positions moving away from E179 and toward T180. Figures were generated using the reported ALD structure (Di Costanzo et al. 2007), with PyMOL (http://pymol.sourceforge.net/) and Spdbv (http://www.expasy.org/spdbv/).

