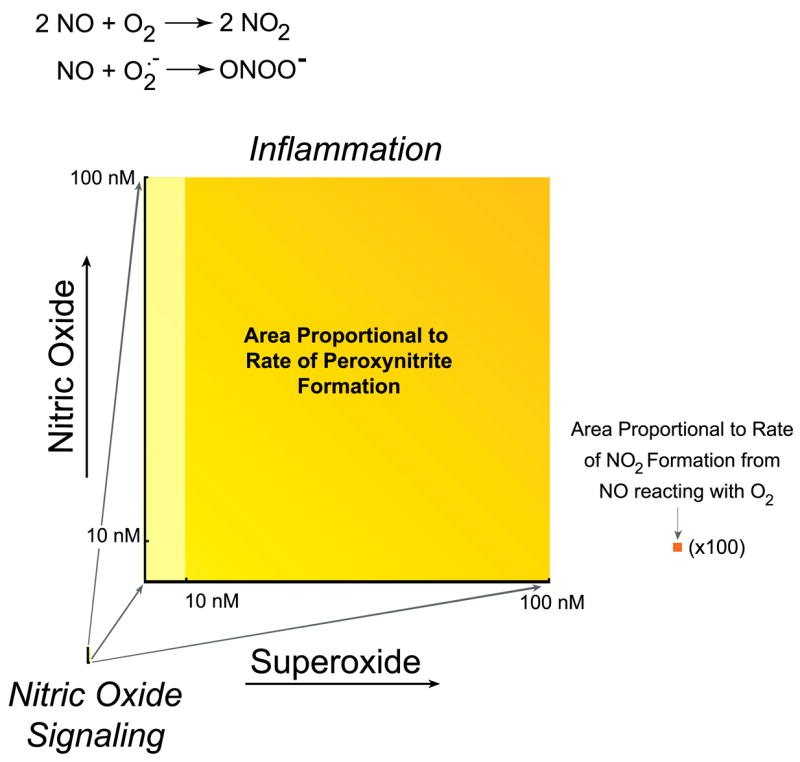
FIG. 2.

Comparison of oxidant production by the reaction of nitric oxide with superoxide versus oxygen. Both reactions are generally given equal weight, but this obscures the vast difference in oxidant productions because of the vast difference in rates. Because the formation of peroxynitrite depends on the product of the concentration of nitric oxide and superoxide, the rate of formation is proportional to the area. Left: estimate of peroxynitrite formation in the cytosol if a cell produces 10 nM nitric oxide, sufficient to activate guanylate cyclase enough to cause at least 10% relaxation of vessels, using 0.1 nM superoxide as an estimate of the basal steady-state concentration of superoxide (777). Right: increase in peroxynitrite formation if the formation of superoxide production increased either 100-fold (yellow) or 1,000-fold (yellow-orange), increases that can reasonably occur with the activation of NADPH oxidase. Nitric oxide is shown to increase only 10-fold and could rise to ~1 μM in highly inflamed states. Far right (orange square): proportional area of nitrogen dioxide formation from 100 nM nitric oxide reacting with oxygen (estimated to be 50 μM in cells), which is magnified 100-fold. This rate is the faster rate occurring in hydrophobic membranes and would be 300-fold smaller in solution (784). Pathways that stimulate the synthesis of superoxide vastly increase oxidant production compared with the reaction of nitric oxide with oxygen.
