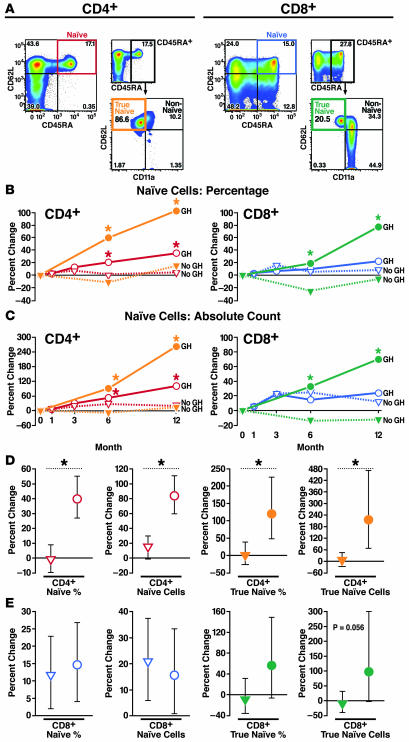
Figure 4. GH treatment is associated with increases in naive T cells in HIV-1–infected adults.
(A) Representative phenotypic analysis of CD4+ and CD8+ naive T cells by flow cytometry. CD11a staining was used to identify a subset of non-naive CD45RA+CD62L+CD11abright T cells and a subset of true naive CD45RA+CD62L+CD11adim T cells. Higher percentages of CD45RA+CD62L+ non-naive T cells were observed among CD8+ T cells. (B and C) Comparison of changes in the GH arm versus observational controls over the first year of the study demonstrated significant increases in the percentage (B, left) and absolute count (C, left) of NCD4 (red) and TNCD4 (orange) cells. There were no increases in the percentage (B, right) and small, nonsignificant increases in the absolute count (C, right) of NCD8 cells (blue) in the GH arm (compared with observational controls) over the first year of the study. TNCD8 (green) increased significantly over the first year of the study in the GH arm. (D) GH-associated increases (circles) in NCD4 cells were confirmed by regression analysis including GH treatment data from observational controls. (E) GH-associated increases (circles) in TNCD8 cells trended toward statistical significance in comprehensive regression analysis. Estimated changes with 95% CIs are shown. Regression analysis estimated the effects of 1 year of GH treatment compared with changes over 1 year in the absence of GH. Median values are shown in B and C. CIs and additional data are shown in Tables 2 and 3. *P < 0.05 for comparison of GH versus no GH.

