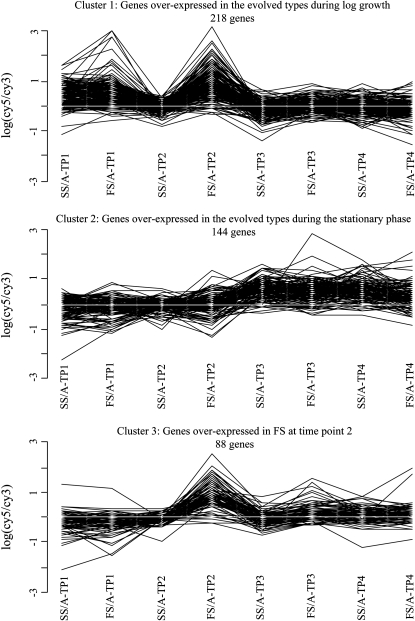
Figure 2.—
The three clusters of differentially expressed genes. Each line corresponds to one gene and indicates the changes in gene expressions between the eight different comparisons. Positive values indicate that the gene has higher expression in the derived strain (FS or SS), and negative values indicate that the gene has higher expression in the ancestor (A). Numbers of genes in each cluster are indicated; 194 of the differentially expressed genes are not clustered.

