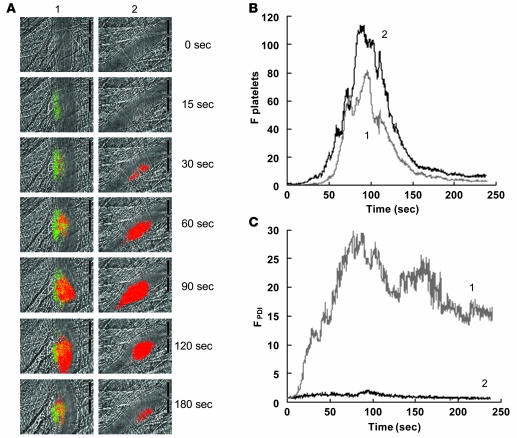
Figure 3. Comparison of PDI expression and platelet accumulation.
Rabbit polyclonal anti-PDI antibodies conjugated to Alexa Fluor 488 (0.3 μg/g BW) and Fab fragments of anti-CD41 antibodies conjugated to Alexa Fluor 647 (0.3 μg/g BW) were infused into a mouse 5 min prior to arteriolar injury. (A) Time course of appearance of the fluorescence signals associated with PDI (green) and platelets (red) over 180 s following laser-induced vessel wall injury in wild-type mice within the context of the bright-field microvascular histology (column 1). In control experiments, anti-PDI antibodies were replaced with nonimmune IgG conjugated to Alexa Fluor 488 (column 2). (B and C) Median integrated platelet fluorescence (B) and median integrated PDI fluorescence (C) after infusion of rabbit affinity-purified anti-PDI antibodies (curve 1; 28 thrombi, 3 wild-type mice) or rabbit nonimmune IgG (curve 2; 32 thrombi, 3 wild-type mice) are presented versus time after vessel wall injury. A representative binarized image is shown in A, and the complete data sets of this and multiple identical experiments are presented in B and C, which plot the integrated fluorescence intensity of all pixels in the image, regardless of their intensity, as a function of time.

