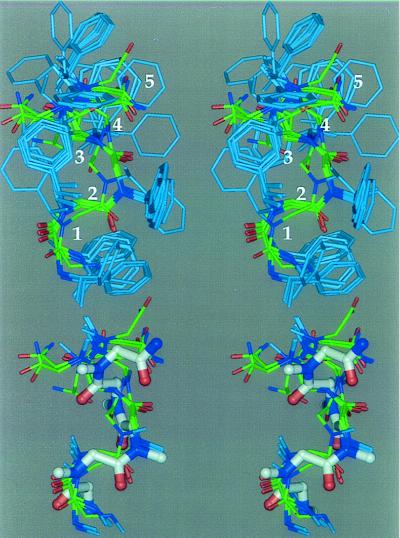
Figure 3.
Stereo representations of the conformations remaining after restraint violation analysis. (Upper) Cluster A. This describes the major conformation of 1 in methanol. Backbone carbons are shown in green, side chain carbons in light blue, nitrogen atoms in dark blue, and oxygen atoms in red. The para substituents on the aromatic rings and the hydrogen atoms have been omitted for clarity. Residue numbers are shown in white. (Lower) Comparison of cluster A conformations with previously published model (6). Only backbone atoms and side chain α carbons are shown. The model is shown as a thicker ball and stick molecule, and its carbon atoms are colored white.

