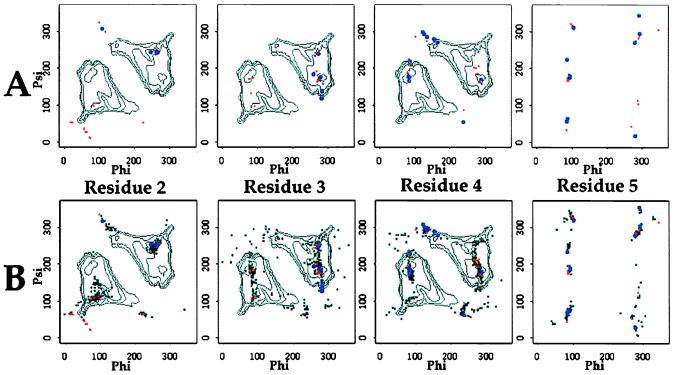
Figure 4.
Distribution of the values of the main chain dihedral angles (φ and ψ) for residues 2 to 5 (residue 1 is not included because there is no proper φ dihedral angle). (A) Cluster A (large blue circles) and clusters B–H (small red circles) after minimization and before ensemble calculation. (B) Same, with cluster A angles after ensemble calculation (small black circles). White contour lines for residues 2–4 indicate the potential surface for Nsnp oligomers, after ref. 6.

