
Figure 2.
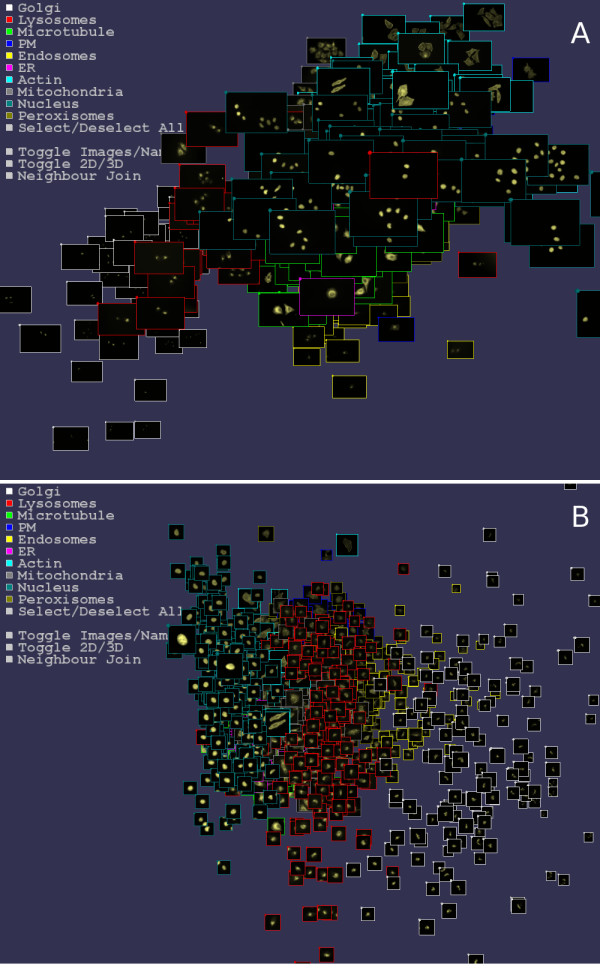
Visualizing the image set in 3 dimensions. (A) The 502 endogenous images visualized in 3 dimensions with coordinates determined from Sammon mapping Haralick and TAS measures. (B) 1407 cell images automatically cropped from the 502 images and visualized in 3 dimensions with coordinates determined from Sammon mapping Haralick and TAS measures. In both (A) and (B) images of each sub-cellular localization are strongly regionalized. In (A) note the clearly nuclear image center right with a lysosome (red border) classification. Possibly the DAPI nuclear image was incorrectly named when the image set was collected. Within the visualizer the user may zoom in/out, rotate, translate, click to select image classes to show/hide, show image names and visualize nearest neighbors (Figure 3). See also Additional file 2 and a simplified java script version available at [17].