
Figure 3.
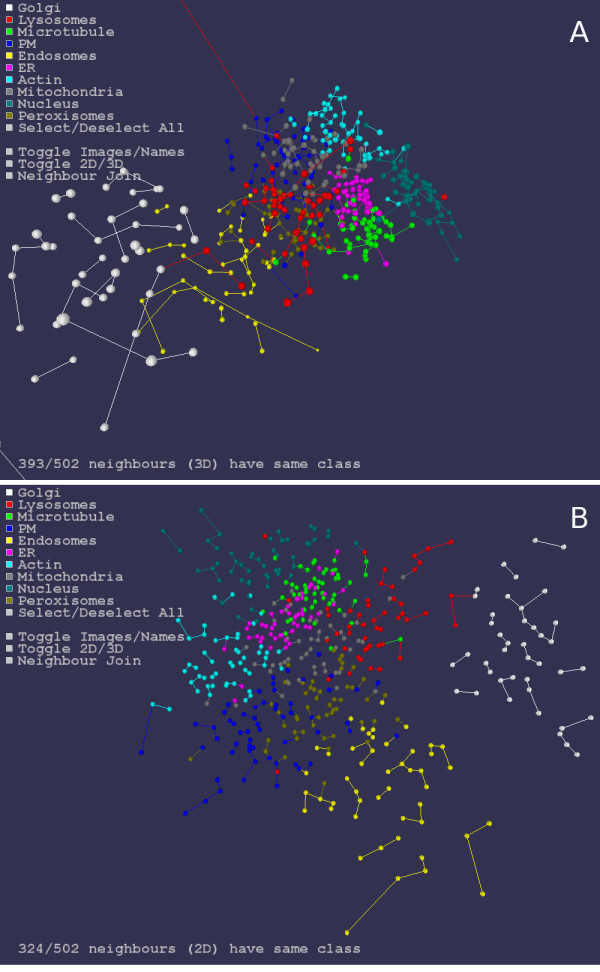
Nearest neighbors in 2 and 3 dimensions. Nearest neighbors for the Sammon mapped Haralick and TAS statistics of the 502 images are shown in 2 (B) and 3 (A) dimensions. Nearest neighbors using the Euclidean distance measure between the images statistics vectors, rather than the Euclidean distance in 2 or 3 dimensions, may also be shown in the visualization. See also Supplementary Movie 3.