Figure 5.

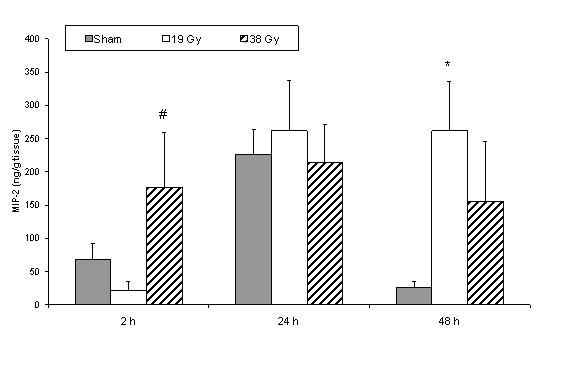
MIP-2 concentration in small bowel tissue comparing sham and different doses of radiation within each time point. * denotes p < 0.05 compared to sham group, # denotes p < 0.05 compared to 19 Gy group.

MIP-2 concentration in small bowel tissue comparing sham and different doses of radiation within each time point. * denotes p < 0.05 compared to sham group, # denotes p < 0.05 compared to 19 Gy group.