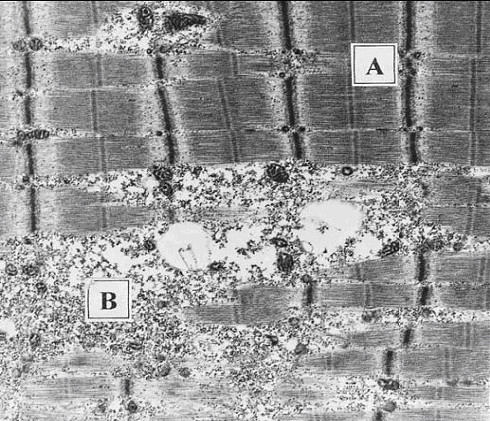
Figure 5.

Electronmicroscopic photograph showing areas of normal (A) and disrupted (B) sarcomeres in a diaphragm sample from a patient with moderate-severe COPD. Note the disruption and even absence of A- and I-bands. Reproduced from Orozco-levi et al. [20] with permission.
