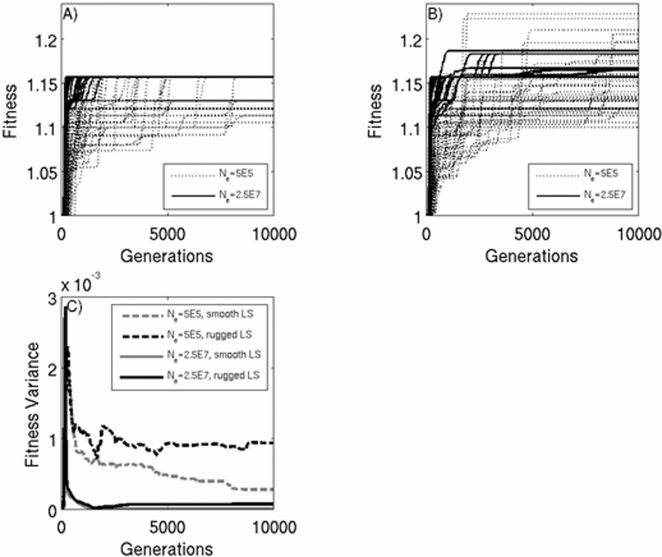
Figure 3. Simulation results of fitness gain in 50 small (dotted line) and large (unbroken line) populations on either a smooth (a) or complex (b) fitness landscape.
The number of 1-step neighbours, L, is 500 and the mutation rate, μ, is 5e-6. Variation in fitness across treatments and population size is shown in Fig 3c.

