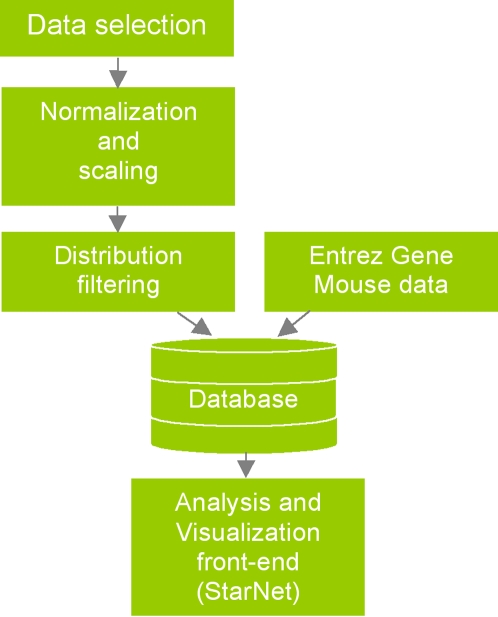
Figure 1. Analysis pipeline.
2145 array samples were selected for the Affymetrix whole genome mouse 430 2.0 array platform. Data were normalized and scaled using justRMALite. The resulting distribution of over 130 million Pearson correlation coefficients was filtered to produce various distributions of the strongest relationships. Correlation data and Entrez Gene annotations were used to populate a new database. StarNet was developed to allow users to make database queries to create and draw correlation networks local to their gene of interest on-the-fly, and to provide supporting information about genes in those networks.

