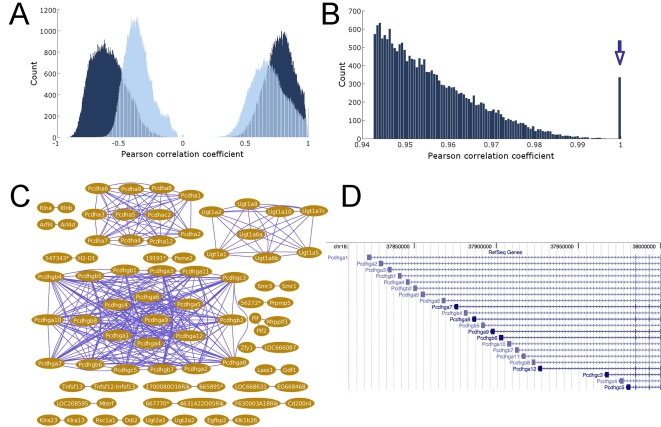
Figure 2. Selected distributions used by StarNet.
a: The cardiac cohort (dark blue) and full cohort (light blue) Genecentric distributions. b: The largest positive correlations in the cardiac cohort. The highest 335 of these associations have a Pearson correlation of 1 (to 16 decimal places), and these form a notable spike at the tail of the distribution (arrow). c: The 335 associations indicated in panel b are composed of 80 genes in the 22 groups of genes shown here. d: The genomic structure of the Pcdhgb1 family of genes (drawn with the UCSC Genome Browser).

